Chart Category Grouping & Sorting
mport ReactPlayer from 'react-player'
Chart Category Grouping & Sorting: This video contains how to use chart category grouping&sorting.
This document contains information on a feature Chart Grouping & Sorting. In OPNBI, Grouping & Sorting is used in Category Axis. We can create a grouping in two types String and Date Time. And create a sorting by column using Ascending or Descending orders. In this Scenario we are using Clustered column Chart widget and in category Axis we are creating Grouping and Sorting. In this example we are creating Grouping in two types String and Date Time. And create a sorting by column using Ascending order.
![]()
- From the right vertical menu select the chart widget icon.
- The Edit menu box appears as you click on chart icon. And a widget gets added in content place automatically in dashboard. As shown in the below image.
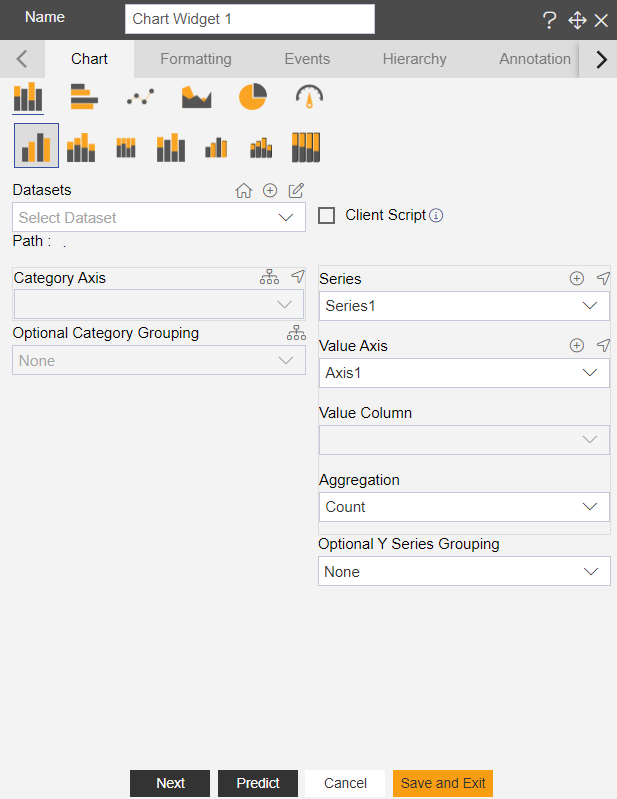
- Enter the following details in the edit menu of the chart: Dataset: Sales.ds Category Axis: Country Value Column: extendedPrice Aggregation: Sum
- Click on the Grouping & Sorting
 Icon in Category Axis, as shown in figure below:
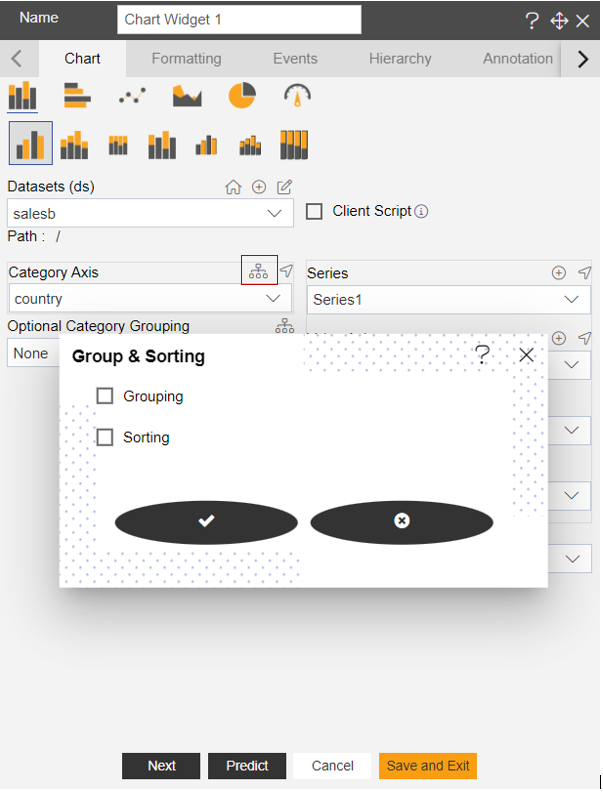
- In Grouping & Sorting Select the Grouping.
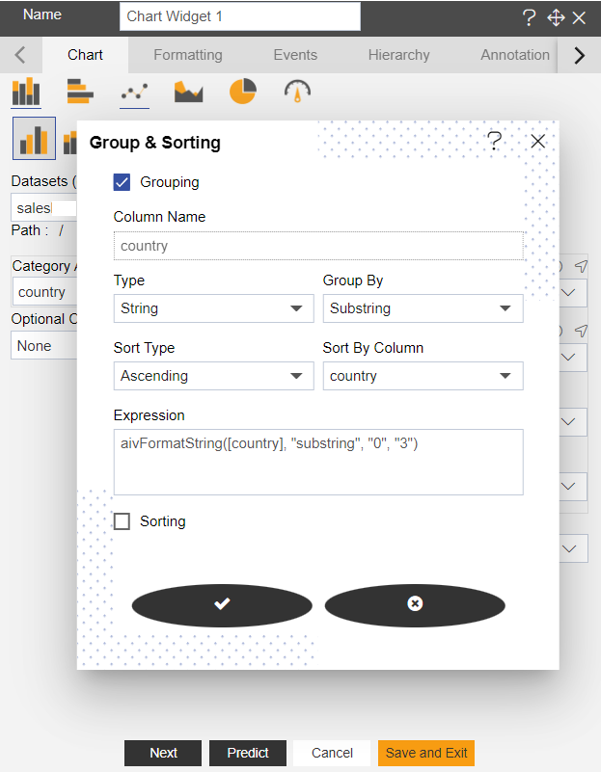
- Enter Following details in Grouping. Type: String Group By: Substring [there are number of groups by options available, user can use any function as per requirement] Sort Type: Ascending Sort By Column: country Expression will be added automatically, as shown in figure below:
- Click on Save
 Icon.
Icon. - Click on Preview and Save and Exit.
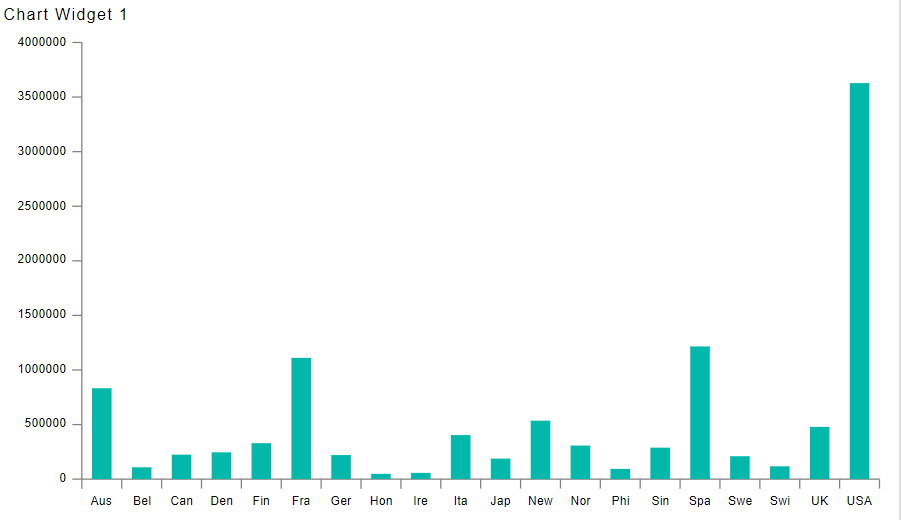
- In Group by Substring First three letter of country name will be displayed and columns are displayed in ascending order, as shown in figure below:
- For Date wise Grouping enter following details in Charts. Dataset: Sales Category Axis: OrderDate Value Column: orderNumber Aggregation: Sum
- Go to the Category Axis >> Group & Sorting icon >> Select Grouping.
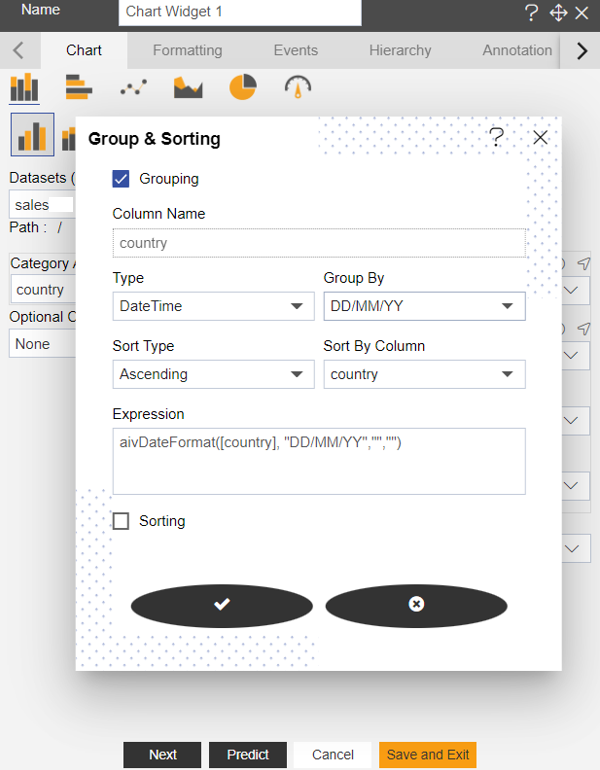
- Enter following details in Grouping. Type: Date Time Group By: DD/MM/YY [there are number of groups by options available, user can use any function as per requirement] Sort Type: Ascending Sort By Column: country Expression will be added automatically, as shown in figure below:
- Click on Save icon.
- Click on Preview and Save and Exit.
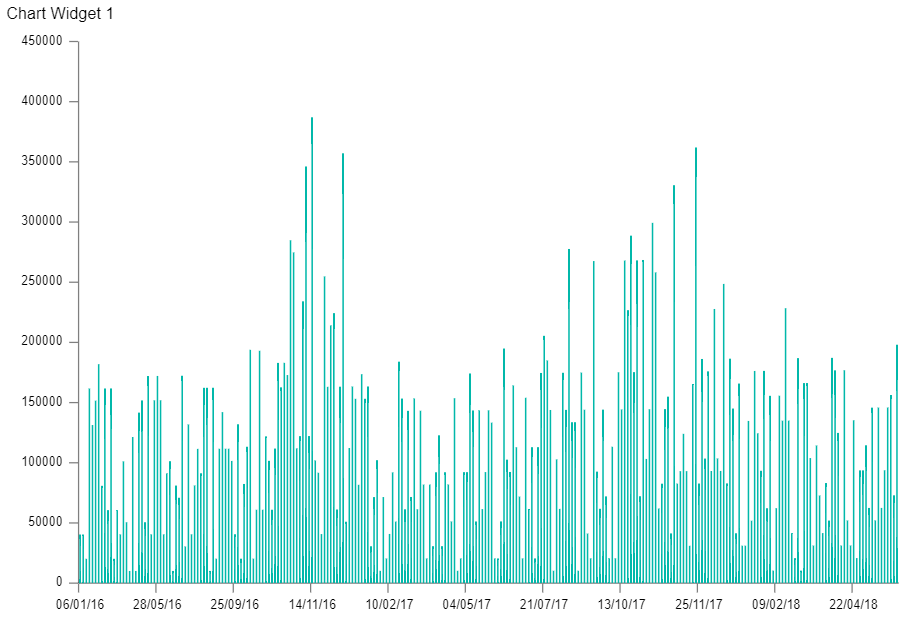
- In Category Axis Date will be display in DD/MM/YY format and columns are displayed in ascending order, as shown in figure below:
- To perform only sorting by Country enter following details in Chart. Dataset: Sales. Ds Category Axis: country Value Column: quantityOrdered Aggregation: Sum
- In Category Axis click on Grouping & Sorting Icon.
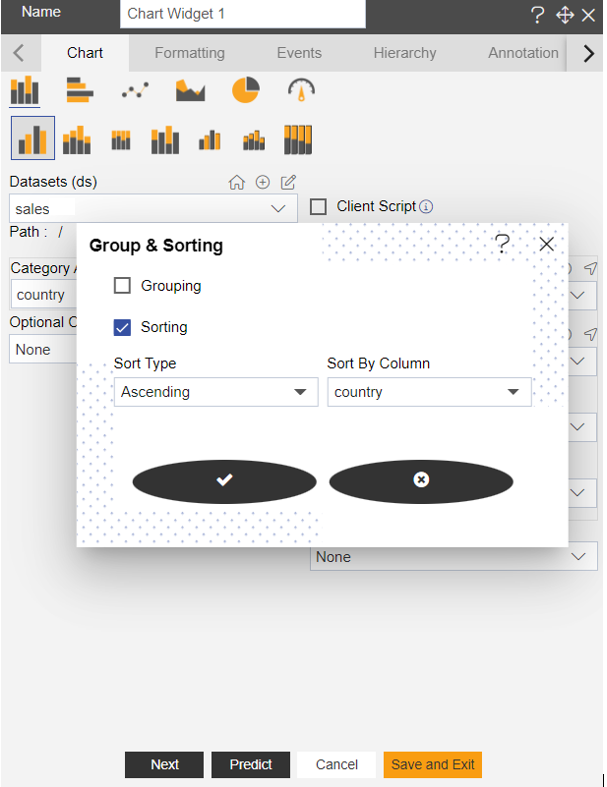
- De-select grouping option
- Select Sorting and enter following details in it. Sort Type: Ascending Sort By Column: Country
- Fill above details, as shown in figure below:
- Click on save Docusaurus Slash Introduction icon.
- Click on Preview and Save and Exit.
- It will display the country name in Ascending order, as shown in figure below: